Inventory Optimization using AI
Introduction
Inventory optimization is an important topic to focus on in the context of inventory/ supply chain management– optimizing inventory at the first level of the supply chain has the ability to affect the rest of the supply chain. An effective way to optimize the inventory is through artificial intelligence. This paper reviews AI methods that optimize inventory such as Some methods that are reviewed include variations of neural networks, genetic algorithms and reinforcement learning. This is a technical overview that I wrote for my Computer Integrated Manufacturing course.
Artificial Neural Networks
Sustrova [1] discusses the construction and results of an artificial neural network (ANN) model that can be used to optimize inventory level and therefore improve the ordering system and inventory management. The work presented in that paper suggests that by using an ANN, the future order amount can be planned based on predicted demand and thus, inventory management can be improved as a part of supply chain management.
Previous Work
Previous methods to optimize inventory management have included the EOQ model, ELSP model, Wagner-Whitin model. These methods are based on assumptions that can be restrictive and do not correspond to realistic manufacturing practices. Some of these methods like the ELSP model are computationally NP-hard problems. Thus, using soft-computing methods such as an ANN can solve the lot-sizing problem for production planning systems in an effective and robust manner.
Methodology
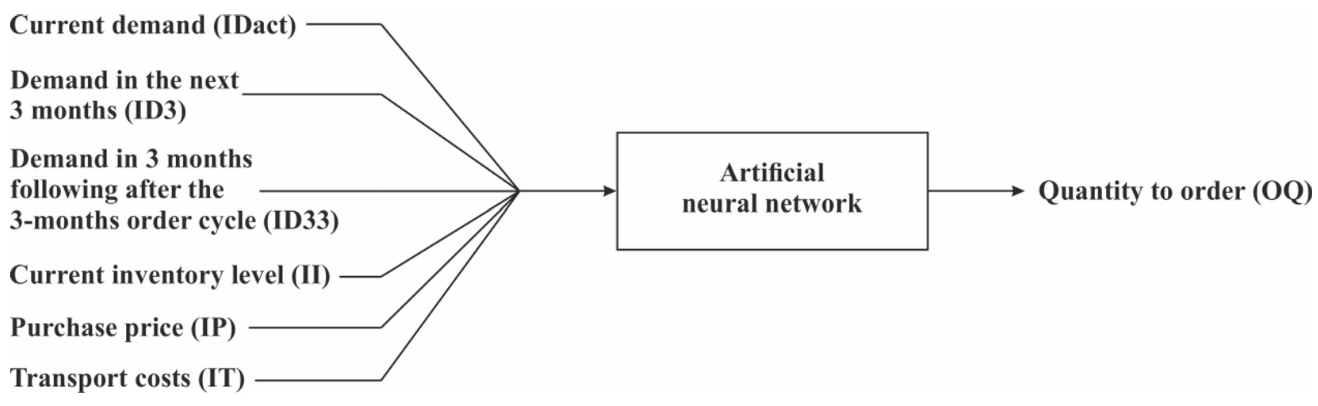
The ANN that was used in this paper [1] was created using a basic, three layer network that consisted of six input parameters connected to eight hidden neurons that then fed into one output value (6-8-1 architecture). The six input variables consisted of the current demand (IDact), demand in the next three months (ID3), demand in three months following the 3-months order cycle (ID33), current inventory level (II), purchase price (IP), and transport costs (IT). The dataset that was used was provided by an existing company– a wholesale dealer with connecting materials. The data for the ANN consisted of 31 data samples from the dataset that consisted of input parameters and target quantity to order (OQ) values. The dataset was split with 77% (24 samples) allocated to testing and 23% (7 samples) allocated or testing. It was found that gradient descent optimization, with a sigmoid activation function. The performance of the network was measured through mean squared error (MSE) and coefficient of determination (R2).
Results
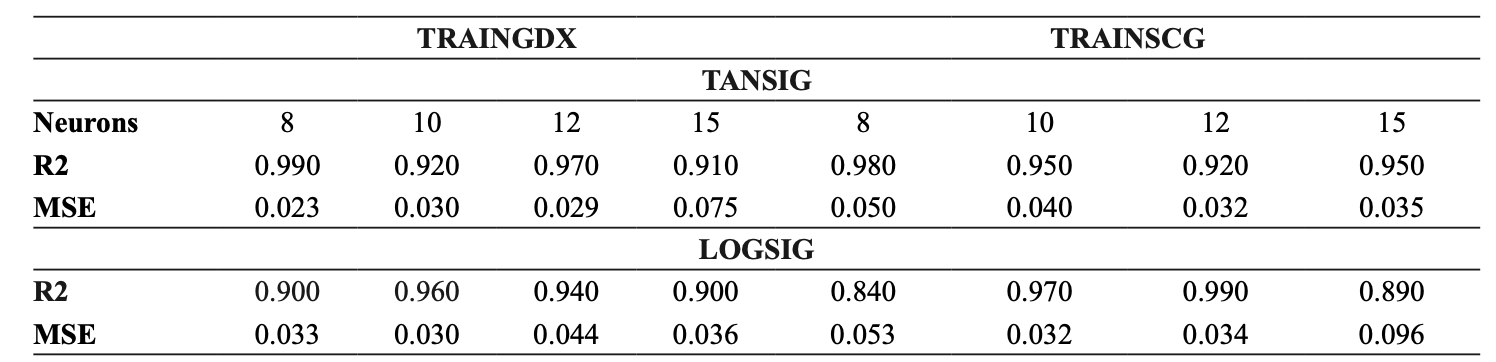
The above table shows the results from training and testing the ANN. The author use compared the results of using gradient descent (TRAINGDX) and scaled conjugate gradient backpropagation (TRAINSCG) optimizations as well as the hyperbolic tangent (TANSIG) and log-sigmoid (LOGSIG) activation functions. Using this network, it was found that the ANN was able to achieve an R2 value of 0.990 and an MSE value of 0.023. Training was done over 1,000 epochs and 1,000 validation checks.
Genetic Algorithns
Radhakrishnan et al. determine the most probable excess stock and shortage levels required for inventory optimization in the supply chain such that supply chain cost is minimized by using genetic algorithms[2].
Methodology
First, the authors establish whether the levels of stock across different supply chain contributors are either in excess or in shortage. A value of zero indicates that the contributor does not need inventory control, while non zero values indicate that a contributor requires inventory control. Then, K-means clustering is used to cluster stock levels that are either in excess or in shortage together and stocks that are neither in excess nor in shortage together. The chromosomes in this model represent the stock levels of the contributors in the supply chain. The entire chain is the chromosome and the different genes within contain the levels of inventory that are either in stock or in excess. Since the authors are analyzing three members of the supply chain (factory, distribution center1, distribution center2), the chromosome is represented as length three, and therefore has three genes.
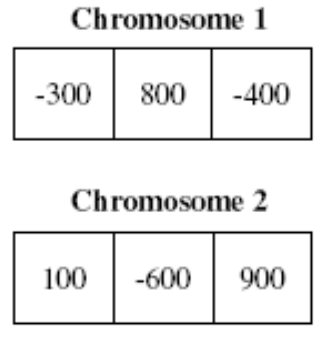
A fitness function is used to ensure that the evolution of the population is reaching an optimal point. This fitness function is used for each chromosome and the chromosomes are then sorted on the bases of the results. Then, the chromosomes go through crossover and mutation operations. The outlined steps are graphically shown in the above figure. After a set number of iterations of calculating the fitness of the population and applying mutation and crossover operations, the best chromosome is selected and is thus considered the optimal solution for inventory control.
Therefore, through the use of genetic algorithms, one can obtain the best stock level to be maintained by all members of the supply chain based on past records. This can essentially reduce the loss in upcoming days created by holding an excess or shortage of inventory.
Results
Upon initialization, two chromosomes are generated: ‘-546 -802 209’ and ‘-155 248 -759’. Then crossover and mutation operations are applied to the chromosomes. The result from these operations is the chromosome ‘546 -759 248’. The authors set the iteration value to be 100. After each iteration, the chromosome moved closer towards the optimal chromosome.
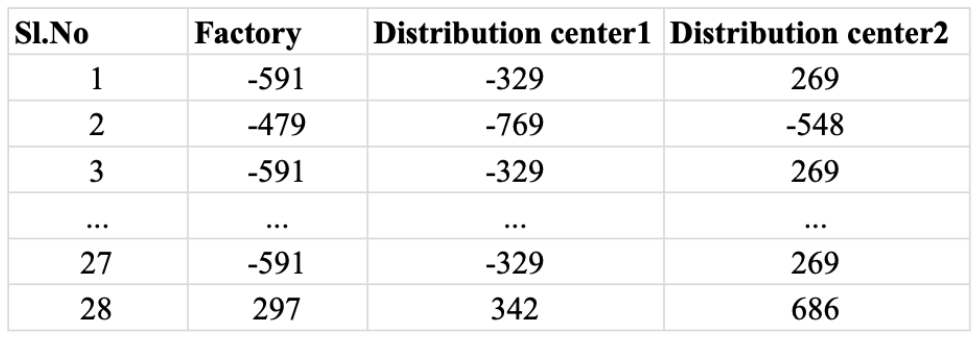
After these 100 iterations, the best chromosome ‘-591 -329 269’ is obtained, as seen in row 28 of the modified data sample (above table). This result is compared to past records to see if it is optimal. Since it is, it can be determined that genetic algorithms are a suitable method to predicting stock levels across the supply chain that can lead to better inventory optimization [2].
IPSO-BPNN Algorithm
In this 2022 paper, Guan et al. [3] explore inventory management optimization of green supply chains using improved particle swarm optimization with a backpropagation neural network (IPSO-BPNN). A green supply chain requires all participants of the supply chain to pay attention to their environmental impact. One important factor in reducing waste within the supply chain is to monitor and optimize inventory management. If products can be produced to meet demand, keep inventory at an optimal level and therefore reduce waste, a manufacturer can be profitable and sustainable simultaneously.
Methodology
The authors of this paper decided to use a BPNN because the model is strong in coordinating various input relationships. However, one downfall to a BPNN is the slow convergence speed, which is why the BPNN was used in tandem with an improved-PSO algorithm. The traditional PSO algorithm can easily fall into local minimums, so the authors sought to improve it by adding a speed mutation operator and by improving the adaptability of learning factors. When the BPNN is trained with the IPSO algorithm, the combination results in improved performance and generalization compared to other algorithms. The BPNN used in this paper is a 3 layer network with six input nodes, and the hidden layer contains 11 nodes. Particle swarm size is 40, maximum particle velocity is 0.5, number of training iterations is 7000, the mutation operator is 0.0001. The data for training the IPSO-BPNN model was the popular Iris dataset that contains various images of three different species of the Iris tectorum Maxim plant. During testing, the model took as input enterprise data that was selected from 2018 to 2021. The daily test results were compared with the monthly test results in terms of network performance.
Results
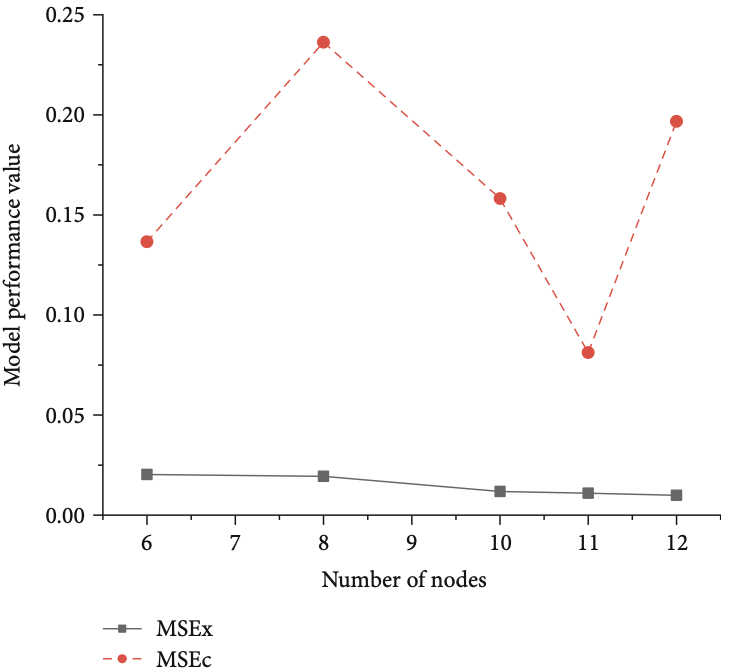
Figure 5 shows the results of training the IPSO-BPNN network in comparison to other algorithms. The error being evaluated reaches a minimum value of 0.033 after 7000 iterations.This shows that the IPSOO-BPNN model has a higher training accuracy compared to using the traditional PSO-BPNN algorithm or just the BPNN model by itself. For testing, Figure 6 shows the inventory forecast performance on a daily scale and Figure 7 shows the inventory forecast performance on a monthly scale. Both of these figures show the model performance values of the forecasts as the number of nodes in the model changes. We can see that the error is lowest when the model contains 11 hidden nodes. Overall, the implementation of the IPSO algorithm during the training of the BPNN led to a model with high accuracy. These results will provide a reference as to how to intelligently optimize inventory management to be profitable while simultaneously sustainable [3].
Figure 5
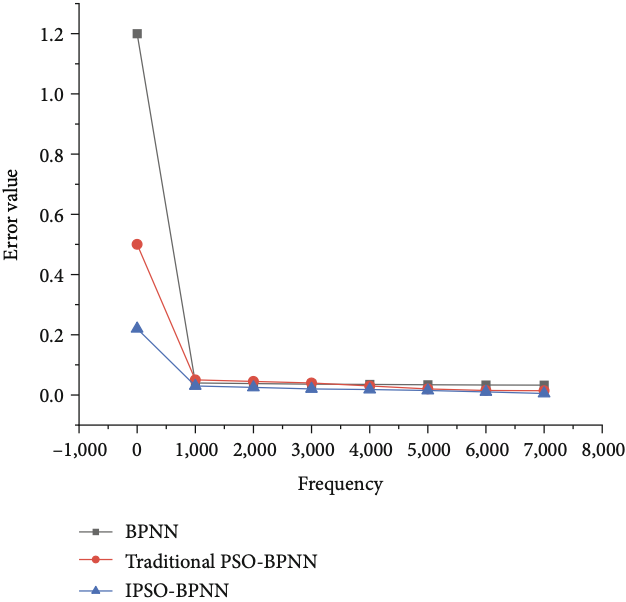
Figure 6

Figure 7
Deep Q-Networks
The Beer Game is a popular game that is used to demonstrate the bull-whip effect: a phenomenon that represents the instabilities and fluctuations in product and supplier orders throughout various stages of the supply chain [5]. Oroojlooyjadid et al. [4] propose a deep Q-network to optimize the replenishment decisions at any given stage. Assuming that the agents in this game follow a base-stock policy, their algorithm obtains near-optimal order quantities.
Methodology
The agents in the game– retailer, warehouse, distributor, and manufacturer are arranged sequentially and numbered as 1 through 4, respectively. The authors create a unified framework in which the agents play independently from one another. During the training phase a feedback scheme is used so that the DQN agent learns the total cost for the whole network and overtime can minimize it. The network is trained on a given set of parameters (e.g. costs, lead times, action spaces). However, if any of these parameters change then the DQN must be retrained. For this reason, the authors propose using transfer learning to decrease the required training time for a new agent.
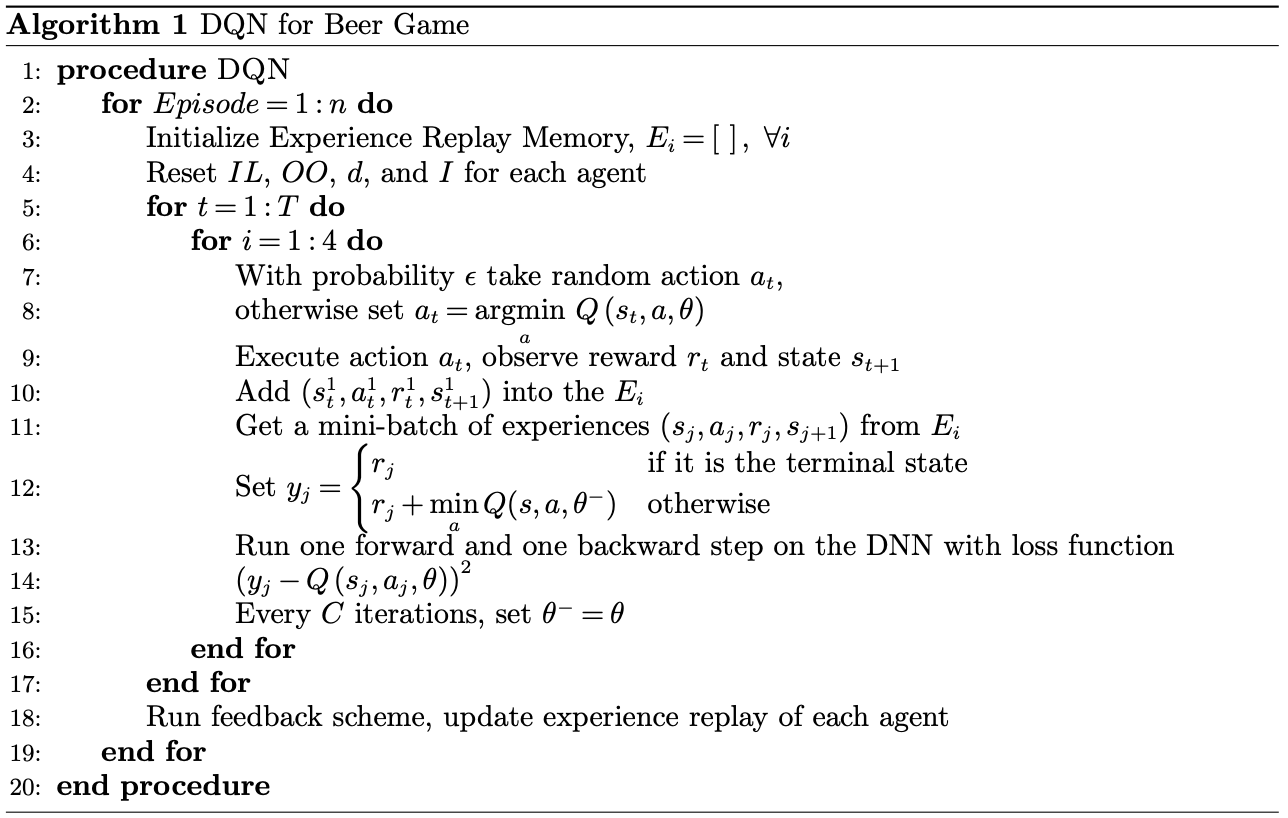
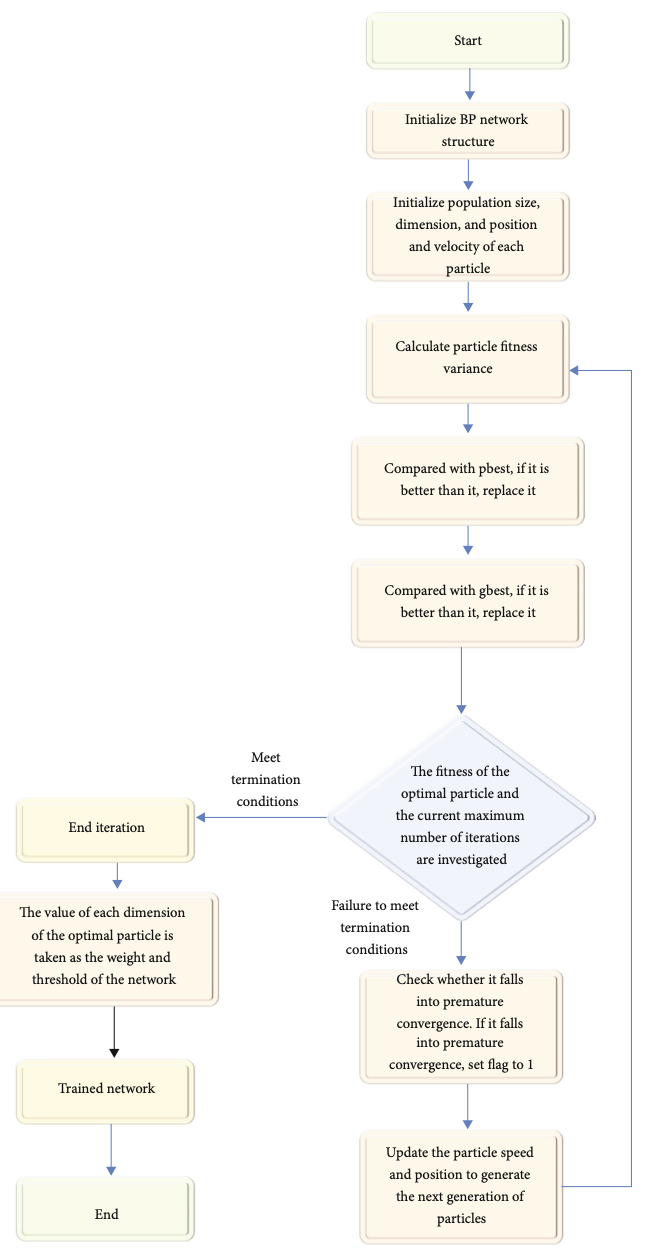
During training the DQN agent does not know any information about the other agents as well as the static and dynamic parameters. To teach the agent to work towards minimizing the total cost for the system, a feedback scheme is proposed. The feedback system consists of Q-learning, state and action spaces, reward function, DNN approximator and DQN algorithm. The state variables that an agent observes are the inventory level, the items that have been ordered by the previous link in the chain, but have not yet been received, size of the demand/order received from the next link in the chain, and size of the shipment received from the previous link in the chain. The DNN architecture requires the state as input and the output is the corresponding Q-value for all of the possible actions. The action space is determined by how much more or less to order based on the received order. That is the order quantity is d + x, where d is the order received and x is some bounded set. The experience replay requires taking a mini-batch of corresponding input and output values to learn Q values. By doing this during every iteration of training, the agent gains an experience memory which contains the previously seen states, actions taken, corresponding rewards, and new observed states. The feedback scheme requires all agents to be made aware of the total reward after any episode of the beer game is finished. The feedback scheme allows the agents to implicitly communicate with each other to reduce the minimum total cost. The overall DQN algorithm is shown in the above figure.
Results
In order to evaluate the performance of the DQN algorithm, the authors compare the results of the DQN to those obtained using the heuristic for base-stock levels in serial systems, as well as models of human beer-game behavior.

The above figure indicates that the DQN performs well in all cases and can find policies whose costs are close to those of the base-stock policy [4].
References
[1] Sustrova, T. (05 2016). A Suitable Artificial Intelligence Model for Inventory Level Optimization. Trends Economics and Management, 10, 48. doi:10.13164/trends.2016.25.48
[2] Radhakrishnan, P., Prasad, W. M., & Gopalan, M. R. (2009). Optimizing Inventory Using Genetic Algorithm for Efficient Supply Chain Management. Journal of Computer Science, 5(3), 233–241. doi:10.3844/jcssp.2009.233.241
[3] Guan, Y., Huang, Y., & Qin, H. (06 2022). Inventory Management Optimization of Green Supply Chain Using IPSO-BPNN Algorithm under the Artificial Intelligence. Wireless Communications and Mobile Computing, 2022. doi:10.1155/2022/8428964
[4] Oroojlooy jadid, A., Nazari, M., Snyder, L., & Takáč, M. (08 2017). A Deep Q-Network for the Beer Game: A Reinforcement Learning Algorithm to Solve Inventory Optimization Problems. Neural Information Processing Systems (NIPS), Deep Reinforcement Learning Symposium 2017.
[5] Ohio University. (2022, July 29). How the Bullwhip Effect Impacts the Supply Chain. https://onlinemasters.ohio.edu/blog/how-the-bullwhip-ef fect-impacts-the-supply-chain/